
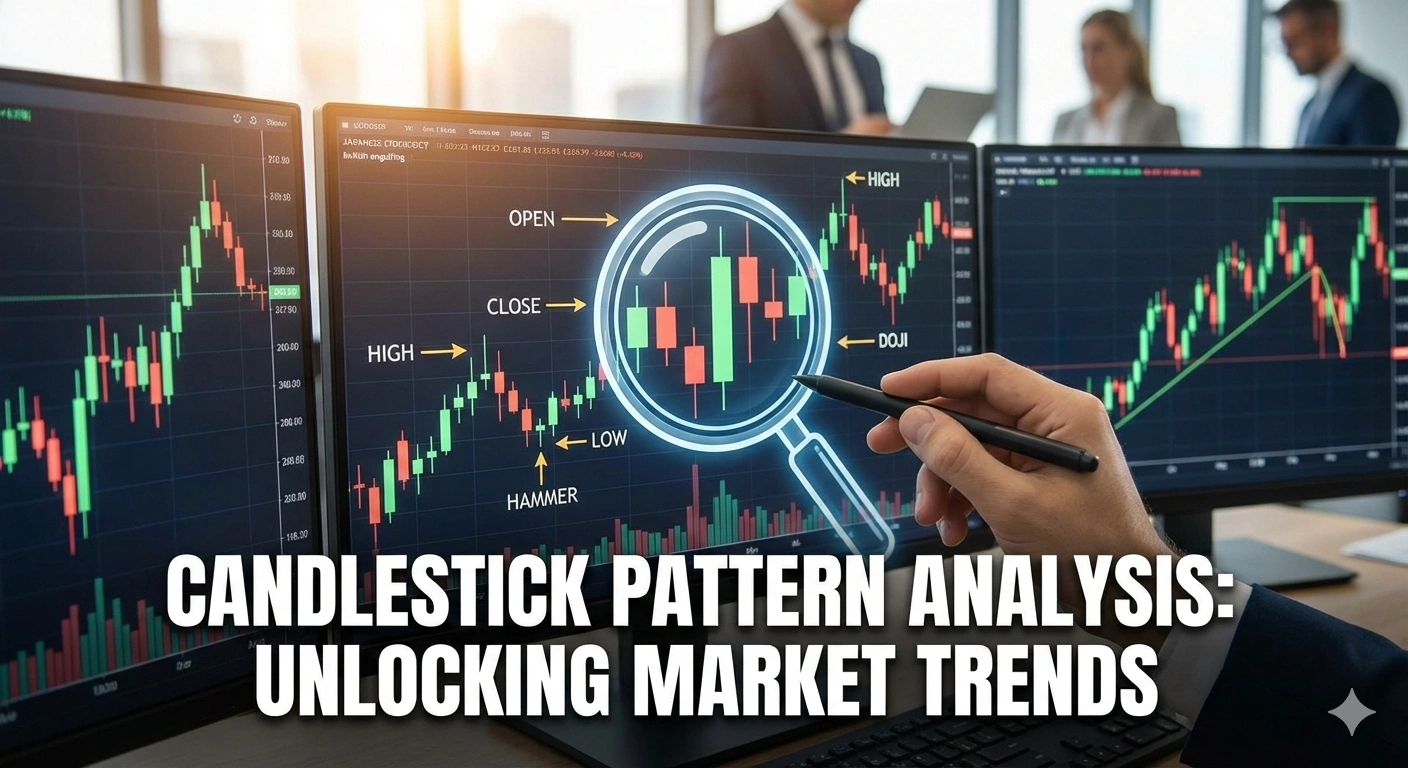
Trading is not about predicting the future. It is about reading what the market is already saying. Candlestick patterns help you do exactly that. In 2026, with faster charts, smarter traders, and algorithm-driven markets, candlestick reading is still one of the most reliable skills a trader can learn.
This guide on trading candlestick patterns 2026 is written for humans, not robots. It starts from the basics and slowly moves to intermediate-level understanding. The language is simple, the flow is natural, and every concept is explained with clarity so you can read it again and still enjoy it.
Why Candlesticks are still relevant
Trading candlestick patterns 2026 explained simply. Learn basic to intermediate patterns, market psychology, and smart trading use for modern markets.
What Are Candlestick Patterns?
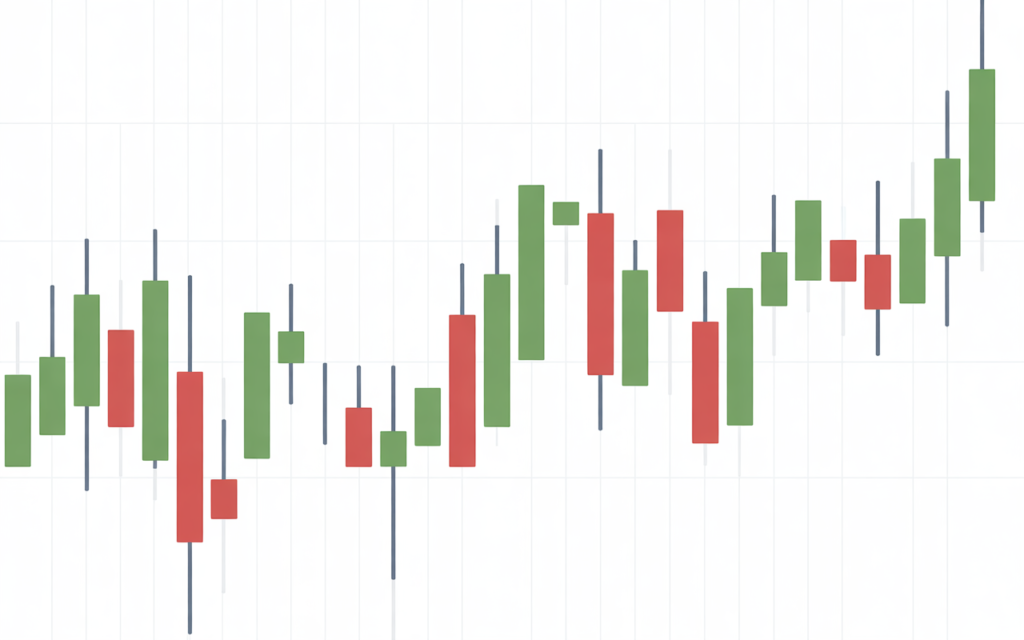
Candlestick patterns are visual tools used in trading charts. Each candle shows four things: open, high, low, and close price for a specific time.
Instead of numbers, candles show emotion. They show fear, greed, hesitation, and confidence. That is why traders still trust them in 2026.
A single candle can tell a story. A group of candles can explain the market mood.
Why Candlestick Patterns Still Work in 2026
Many people believe algorithms have killed simple chart reading. That is not true.
Candlestick patterns work because:
Therefore, trading candlestick patterns 2026 remains a core skill for traders.
Anatomy of a Candlestick (Basic Foundation)
Each candlestick has:
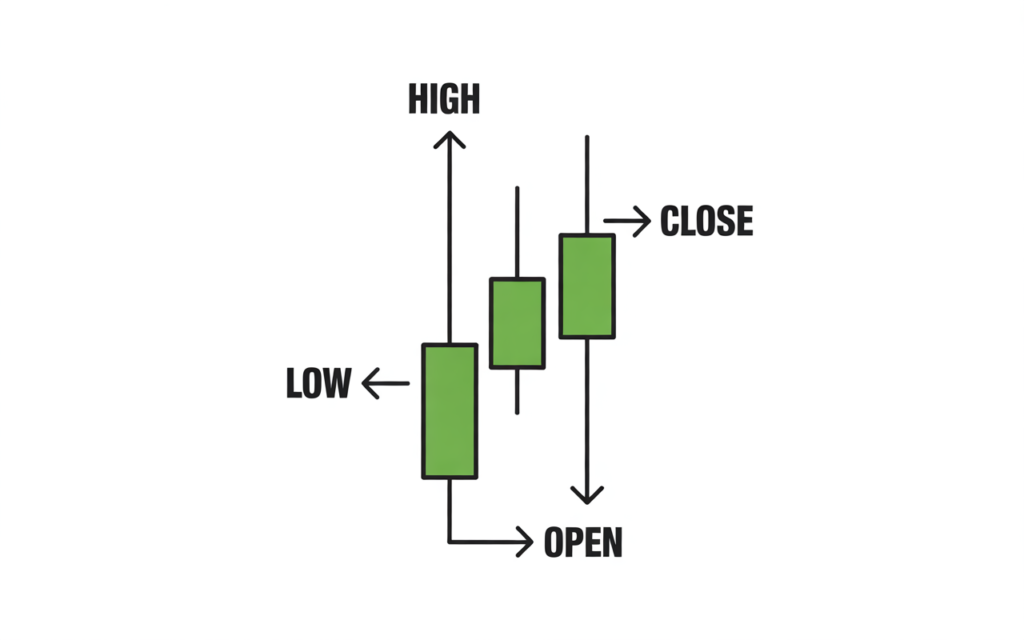
A long body shows strength. A small body shows indecision. Long wicks show rejection.
Understanding this is more important than memorizing patterns.
Single Candlestick Patterns (Beginner Level)
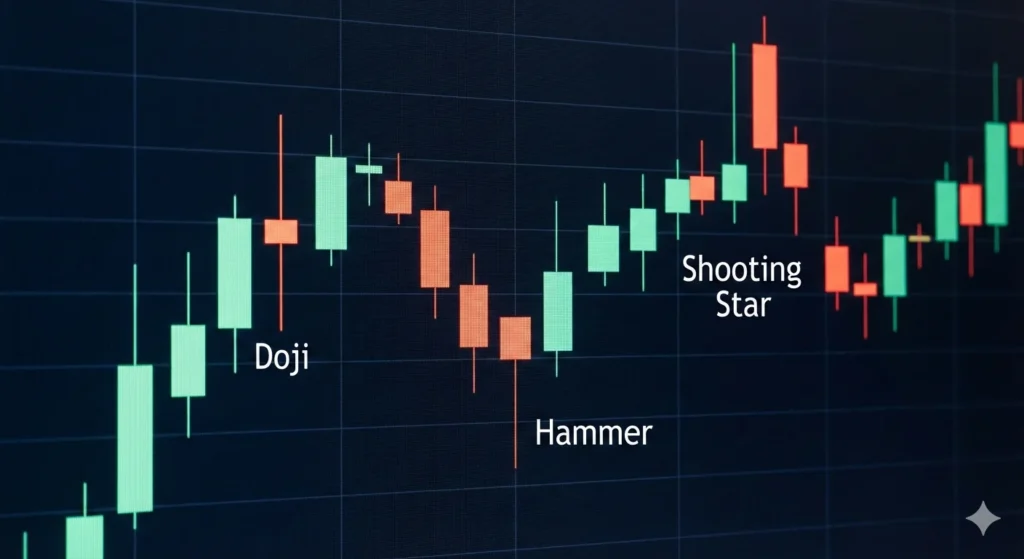
Doji
A Doji forms when open and close are almost the same.
It signals indecision. Buyers and sellers are balanced.
Doji works best near support or resistance.
Hammer
A Hammer has a small body and long lower wick.
It appears after a downtrend and signals possible reversal.
Psychology: sellers tried to push price down but buyers rejected it.
Shooting Star
A Shooting Star appears after an uptrend.
It shows rejection from higher levels.
Psychology: buyers failed to hold highs.
Two-Candlestick Patterns (Next Level)
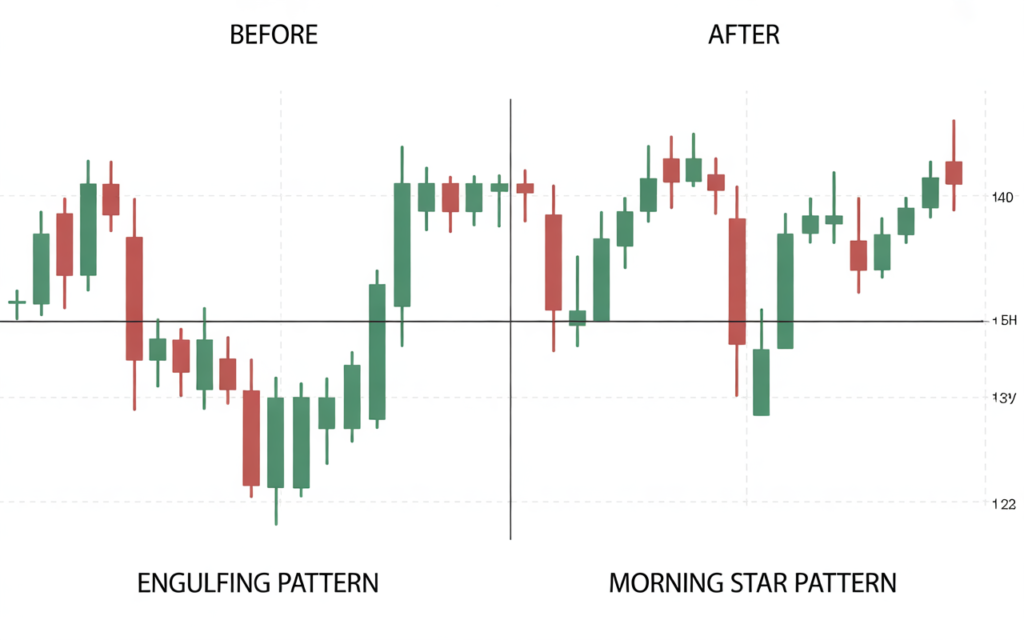
Bullish Engulfing
A large green candle completely covers the previous red candle.
It shows strong buyer control.
Best used near support.
Bearish Engulfing
A large red candle covers the previous green candle.
It signals potential trend reversal.
Works well near resistance.
Three-Candlestick Patterns (Intermediate Level)
Morning Star
Appears after a downtrend.
It shows transition from sellers to buyers.
This is a high-probability reversal pattern.
Evening Star
Opposite of Morning Star.
Appears after an uptrend.
Signals weakening buyer strength.
Continuation Candlestick Patterns
Rising Three Methods
Price pauses briefly and then continues upward.
This pattern shows healthy trend continuation.
Falling Three Methods
Shows temporary pause in a downtrend.
Confirms sellers are still in control.
How to Trade Candlestick Patterns Safely in 2026
Candlestick patterns alone are not magic.
Use them with:
This increases accuracy significantly.
Timeframes That Work Best
In 2026, higher timeframes remain more reliable.
Common Mistakes Traders Still Make
Candlestick patterns guide decisions, not emotions.
Candlestick Patterns vs Indicators
Indicators lag. Candlesticks lead.
Smart traders use indicators for confirmation, not prediction.
Price always moves first.
Practical Trading Mindset
Candlestick patterns help you:
Consistency matters more than accuracy.

Final Thoughts
Learning trading candlestick patterns 2026 is like learning a new language. At first it feels confusing. Over time, charts start speaking clearly.
Do not rush. Observe patterns. Journal trades. Respect risk.
Candlesticks do not promise profits. They offer clarity.
building long-term financial discipline and secure your bike now though our bike insurance guide 2026
FAQs
Are candlestick patterns enough for trading?
No. They should be combined with support, resistance, and risk management.
Do candlestick patterns work in all markets?
Yes. Stocks, crypto, forex, and commodities.
Which pattern is most reliable?
Engulfing and Morning/Evening Star patterns.